Infer
“People generally see what they look for, and hear what they listen for.”
— Harper Lee, To Kill a Mockingbird
Dr. Jerid Francom
Apr 10, 2024
Overview
- Orientation
- Statistical inference
- Workflow with
infer
- Workflow with

Process


Orientation
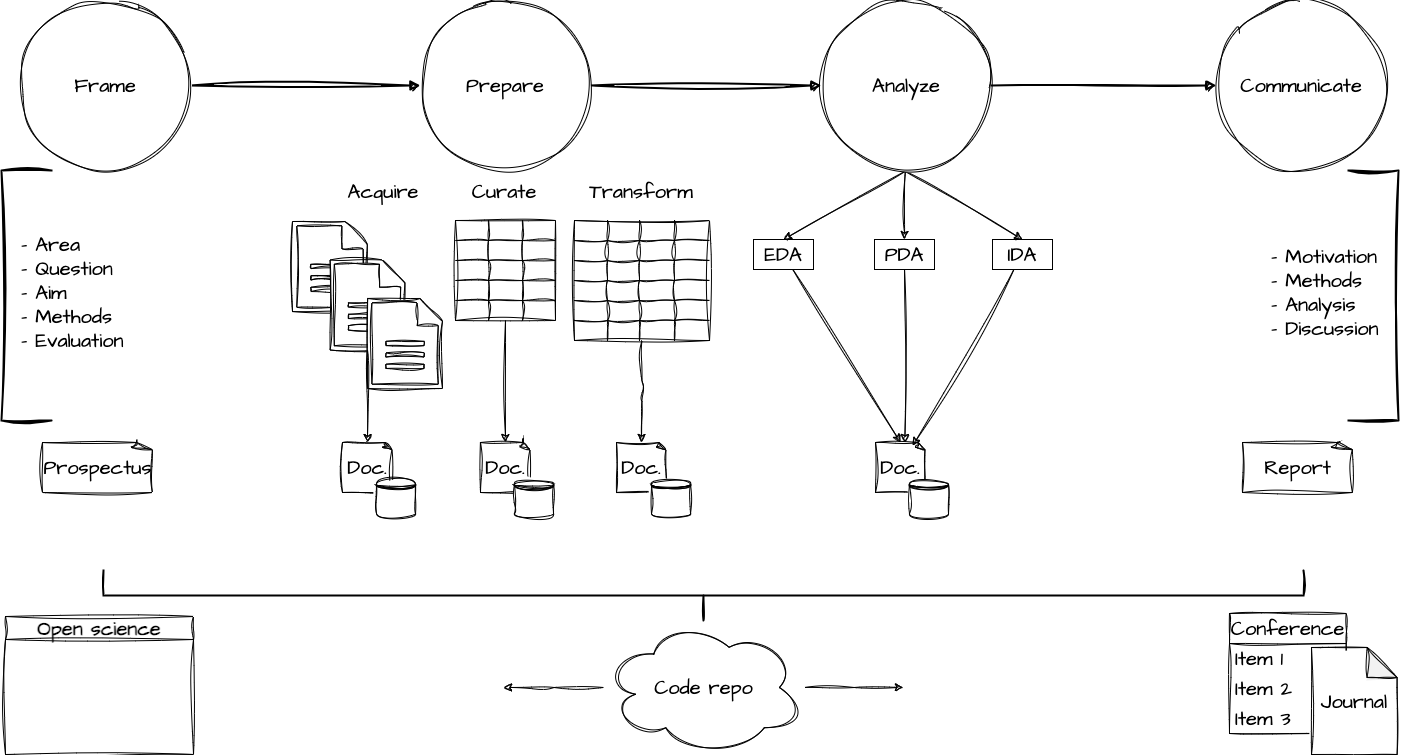
Inferential Data Analysis
Goals
- Assess hypotheses
When to use
- To make inferences about a population
generalize from a sample
How to use
- Identify, Inspect, Interrogate, Interpret
- Non-iterative
Statistical inference
Paradigm
Null Hypothesis Significance Testing (NHST)
- \(H_0\) Null hypothesis: no effect
assumed true from the outset - \(H_1\) Alternative hypothesis: effect exists
only if we have evidence to reject the null hypothesis
Evidence: the likelihood of the observed statistic(s) if the null hypothesis is true is below some pre-specified threshold (significance level).
Approaches
Theory-based NHST
- Classical
- Based on theoretical distributions
- Requires assumptions about the data (ex. parametric, non-parametric)
- Relies on conceptual understanding of mathematical properties
- Tends to be more difficult to understand (for non-statisticians)
Simulation-based NHST
- Empirical
- Based on resampling methods
- Does not require assumptions about the data
- Frames the problem in terms of the data
- Easier to understand (for non-statisticians)
The infer (Couch et al. 2021) package is a simulation-based approach to NHST.
Workflow with infer
A. Identify
- Map the hypothesis to the response and explanatory variable(s)
- Determine the information types and relationship(s) between the variables.
- Choose the relevant test statistic and significance level
B. Inspect
- Summarize and visualize the relationship(s) between the variables
- Check assumptions (if necessary)
- Choose resampling method (bootstrap, permutation, etc.)
C. Interrogate
- Generate the null distribution
- Specify the relationship(s)
- Calculate the observed test statistic
- Calculate the p-value
- Generate the resampling distribution of the test statistic
- Calculate the confidence interval
D. Interpret
- Evaluate p-value and confidence interval
- Evaluate evidence in the context of the research question
Statistical test designs
| Scenario | Explanatory variable(s) | Statistical test | infer |
|---|---|---|---|
| Univariate | - | Proportion | prop |
| Bivariate | Categorical | Difference in proportions | diff in props |
| Bivariate (>2 levels) | Categorical (3+ levels) | Chi-square | chisq |
| Multivariate | Categorical or Numeric (2+ variables) |
Logistic regression | fit() |
Statistical test designs
| Scenario | Explanatory variable(s) | Statistical test | infer |
|---|---|---|---|
| Univariate | - | Mean | mean |
| Bivariate | Numeric | Correlation | correlation |
| Bivariate | Categorical (2 levels) | Difference in means | diff in means |
| Bivariate | Categorical (3+ levels ) | ANOVA | f |
| Multivariate | Numeric or Categorical (2+) | Linear regression | fit() |
Case study: Passives x Variety
| RQ | Difference in passives between American and British English |
| Population | Written American and British English |
| Hypothesis | British English uses more passives than American English |
| Null hypothesis | No difference in passives between American and British English, or American English uses more passives |
Identify
| Mapping | pass_rate ~ var |
| Information types | Resp: num, Exp: cat (2 levels) |
| Test statistic | Difference in means |
| Significance level | 0.05 |
Inspect: summaries
With a bivariate relationship where the explanatory variable has two levels, we can use a boxplot or density plot to visualize the distribution of the response variable.
Interrogate: calculate observed statistic
Interrogate: generate null distribution
Interrogate: calculate p-value
Interrogate: generate resampling distribution
Interrogate: calculate confidence interval
Interpret
Wrap-up
Final thoughts
- Inferential data analysis is a powerful tool for making inferences about a population based on a sample.
- The
inferpackage provides a simulation-based approach to NHST that is easier to understand than classical methods.
Case study: Passives x Genre
| RQ | Difference in passives between genres in English |
| Population | Written English |
| Hypothesis | More formal genres use more passives than less formal genres |
| Null hypothesis | No difference in passives between genres, or less formal genres use more passives |
Identify
| Mapping | pass_rate ~ genre |
| Information types | Resp: num, Exp: cat (9 levels) |
| Test statistic | ANOVA (f) |
| Significance level | 0.05 |
Inspect: summaries
Interrogate: calculate observed statistic
Interrogate: generate null distribution
Interrogate: calculate p-value
Interrogate: generate resampling distribution
Interrogate: calculate confidence interval
Interpret
References

Infer | Quantitative Text Analysis | Wake Forest University
Couch, Simon P., Andrew P. Bray, Chester Ismay, Evgeni Chasnovski, Benjamin S. Baumer, and Mine Çetinkaya-Rundel. 2021. “infer: An R Package for Tidyverse-Friendly Statistical Inference.” Journal of Open Source Software 6 (65): 3661. https://doi.org/10.21105/joss.03661.