Explore
“The data speaks for itself, but only if you are willing to listen.”
— Nate Silver”
Mar 27, 2024
Overview
- Orientation
- Descriptive analysis
- Unsupervised learning
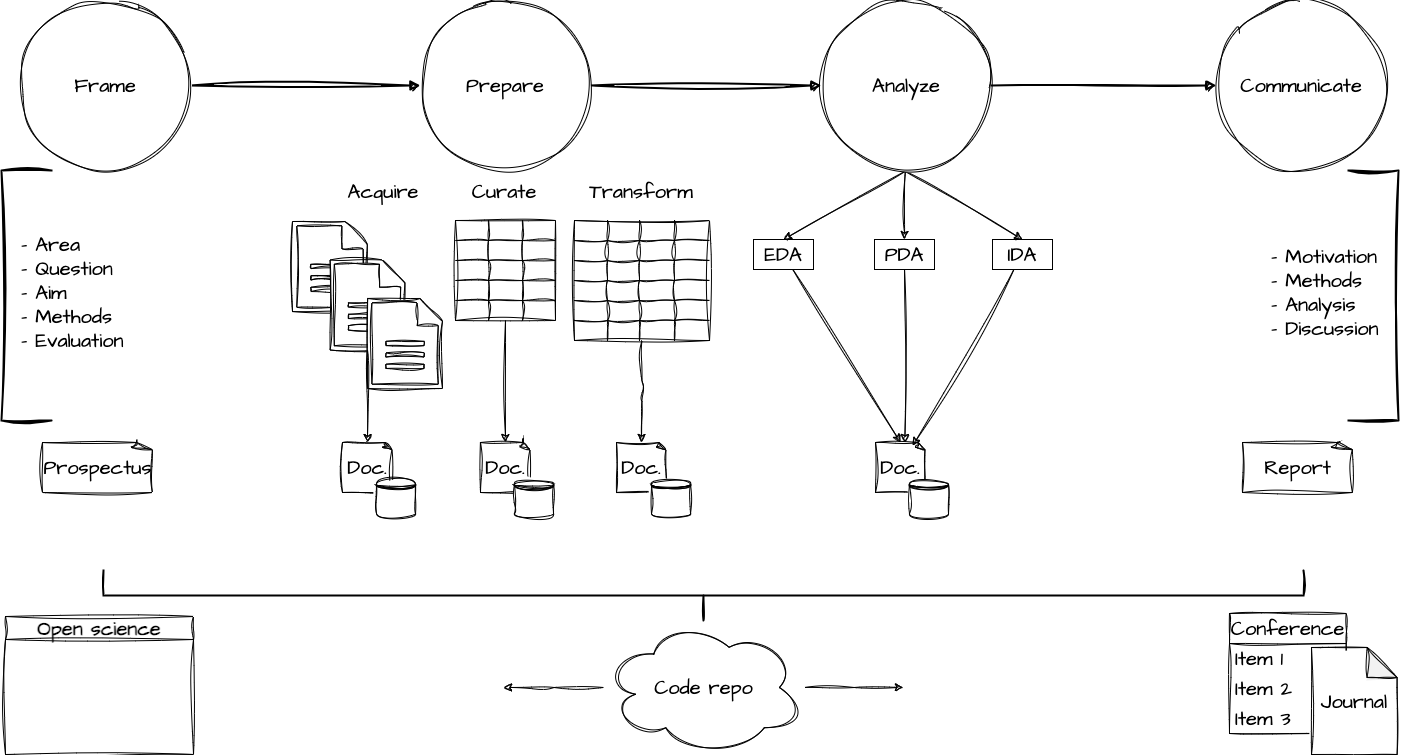
Process
Things to consider
- Tokenization
- Operationalization
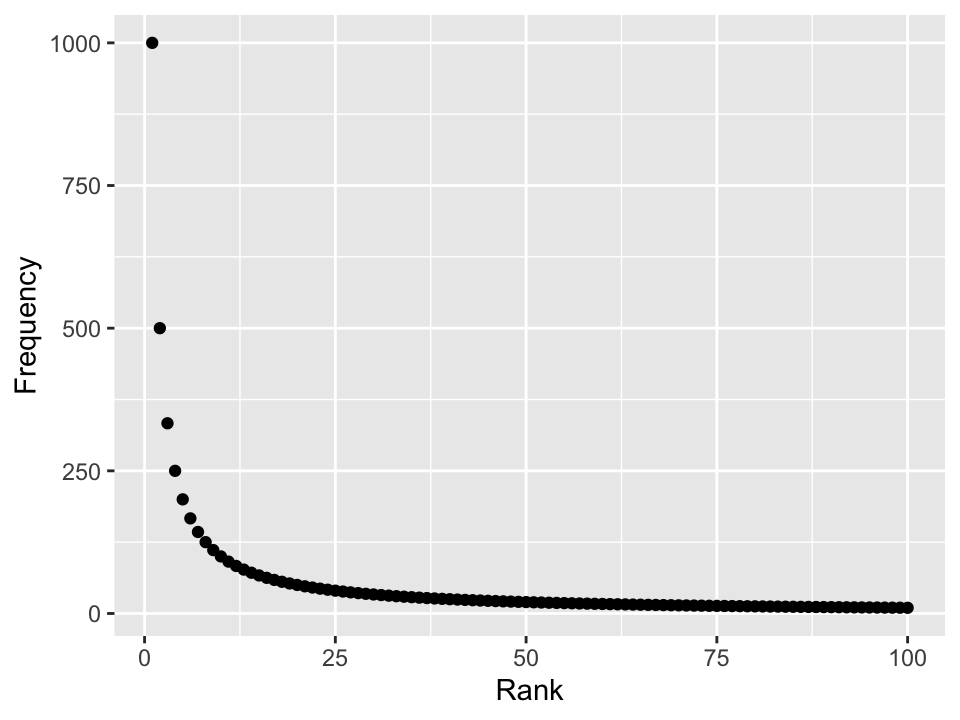
- Zipf distribution

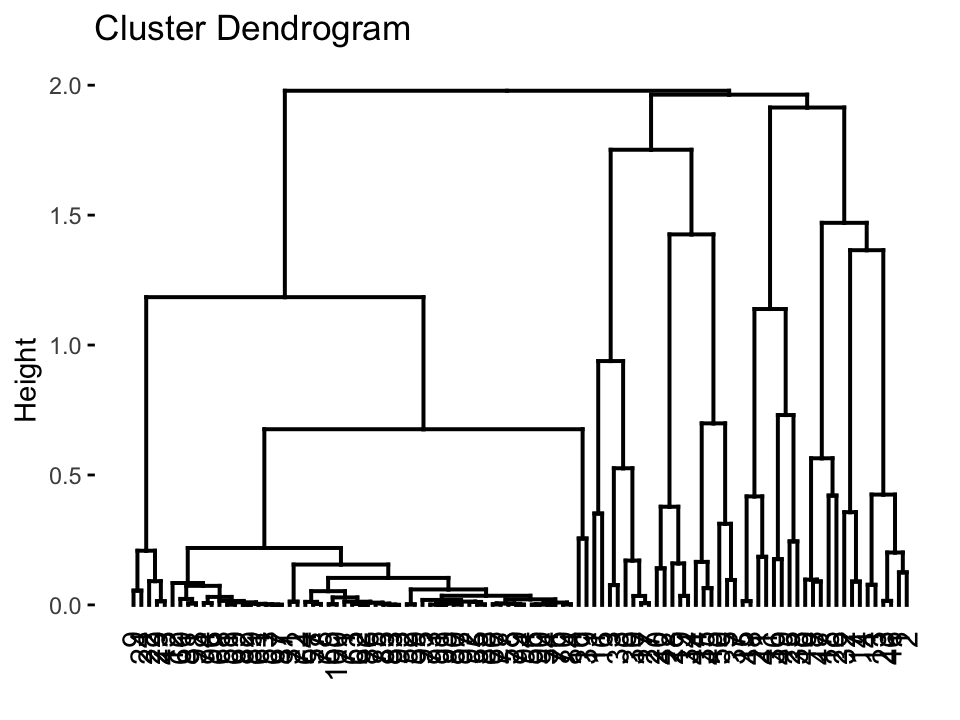
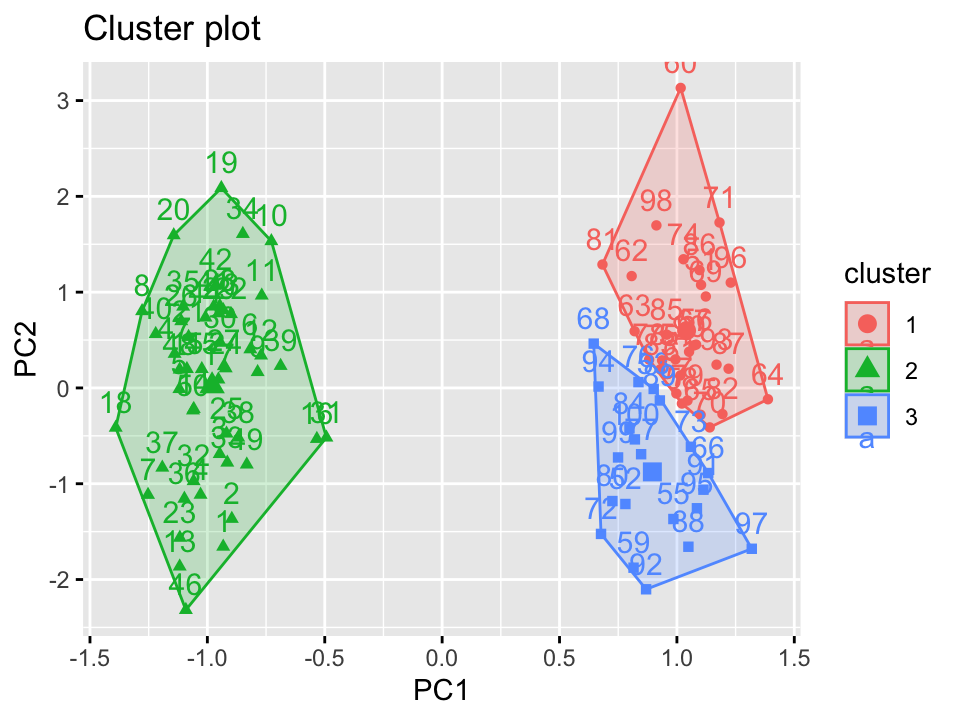
What can clustering tell us?
- Patterns of similarity/ dissimilarity
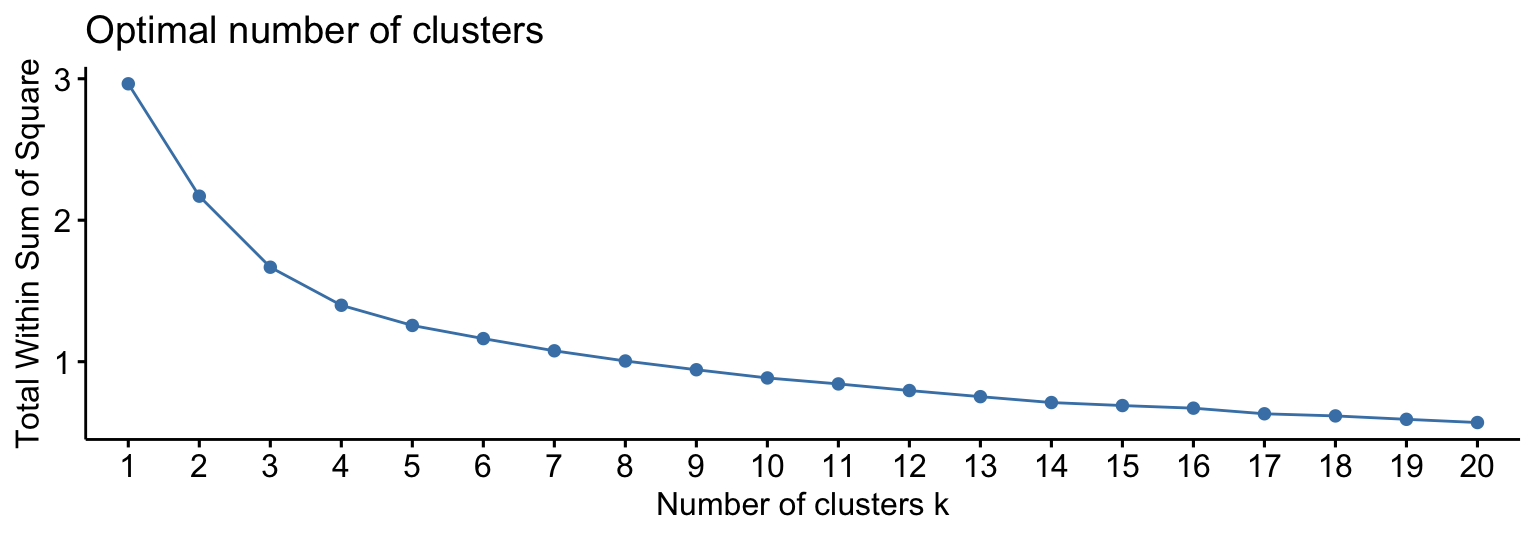
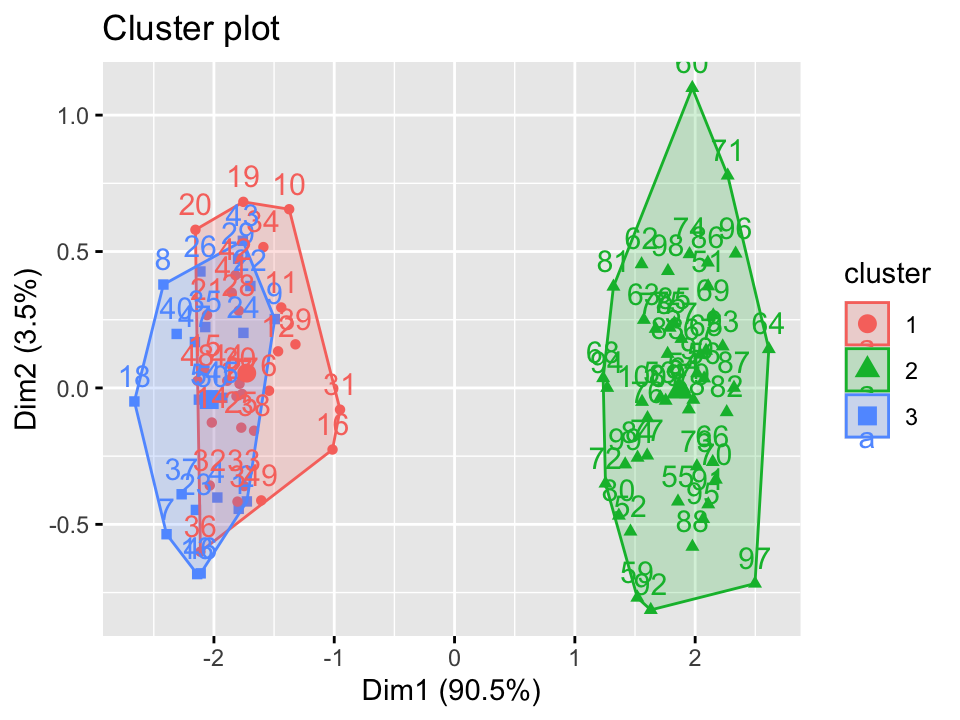
- Number of groups
- Homogeneity within groups
- Heterogeneity between groups

Things to consider
- Previous knowledge
- Number of clusters
- Distance metric (Heirarchical clustering)
Things to consider
- Interpretability
- Number of dimensions
- Overfitting/ Underfitting
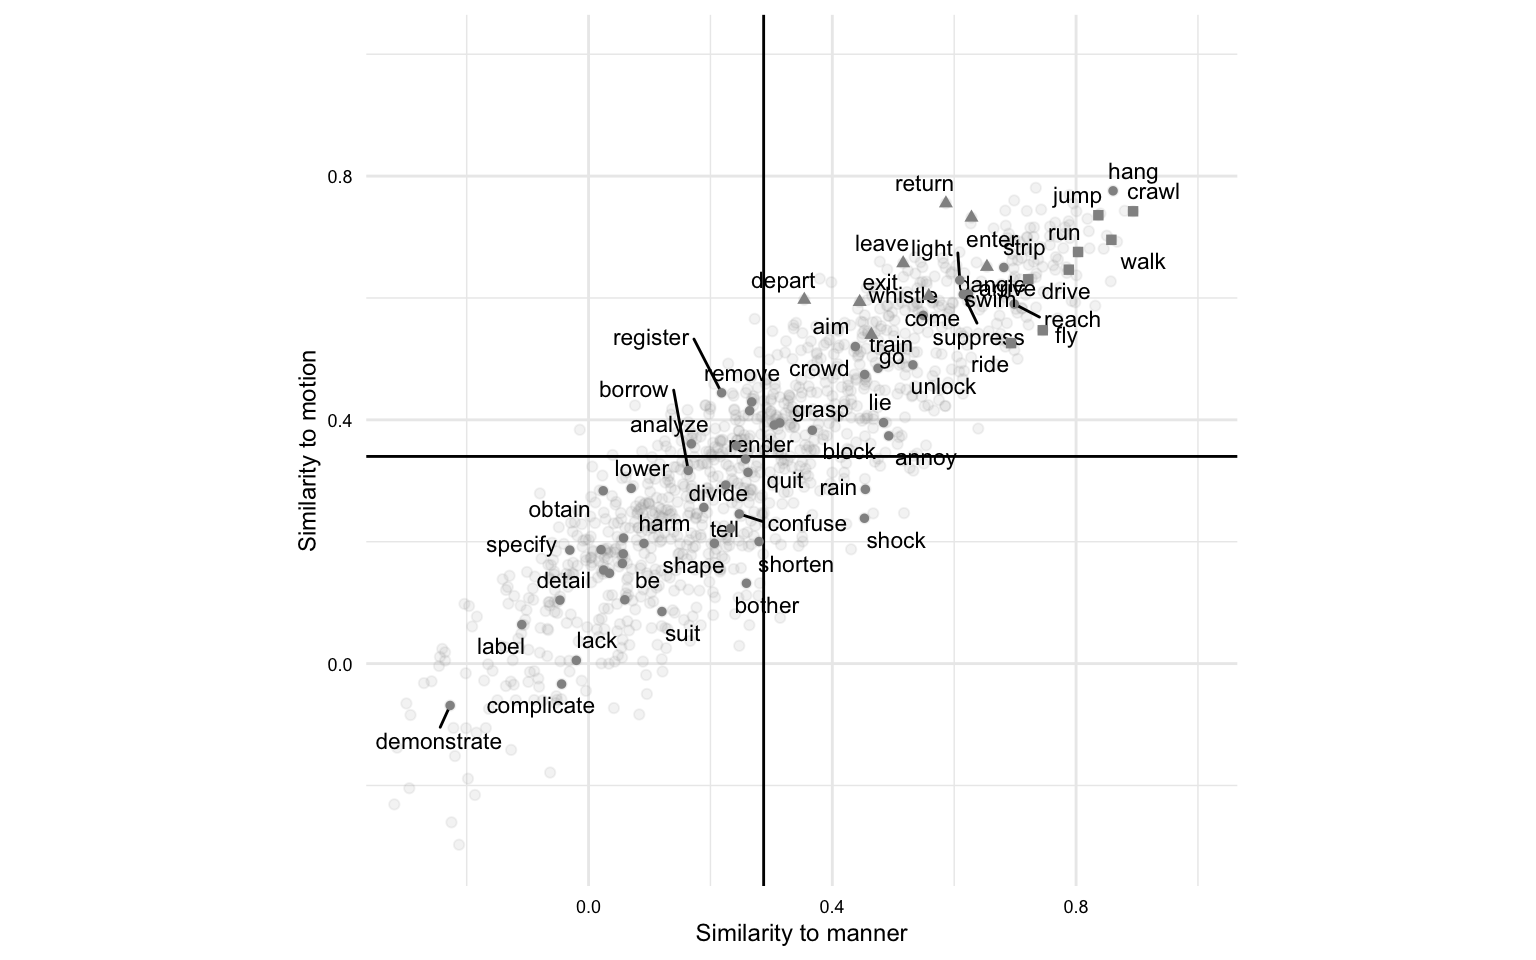
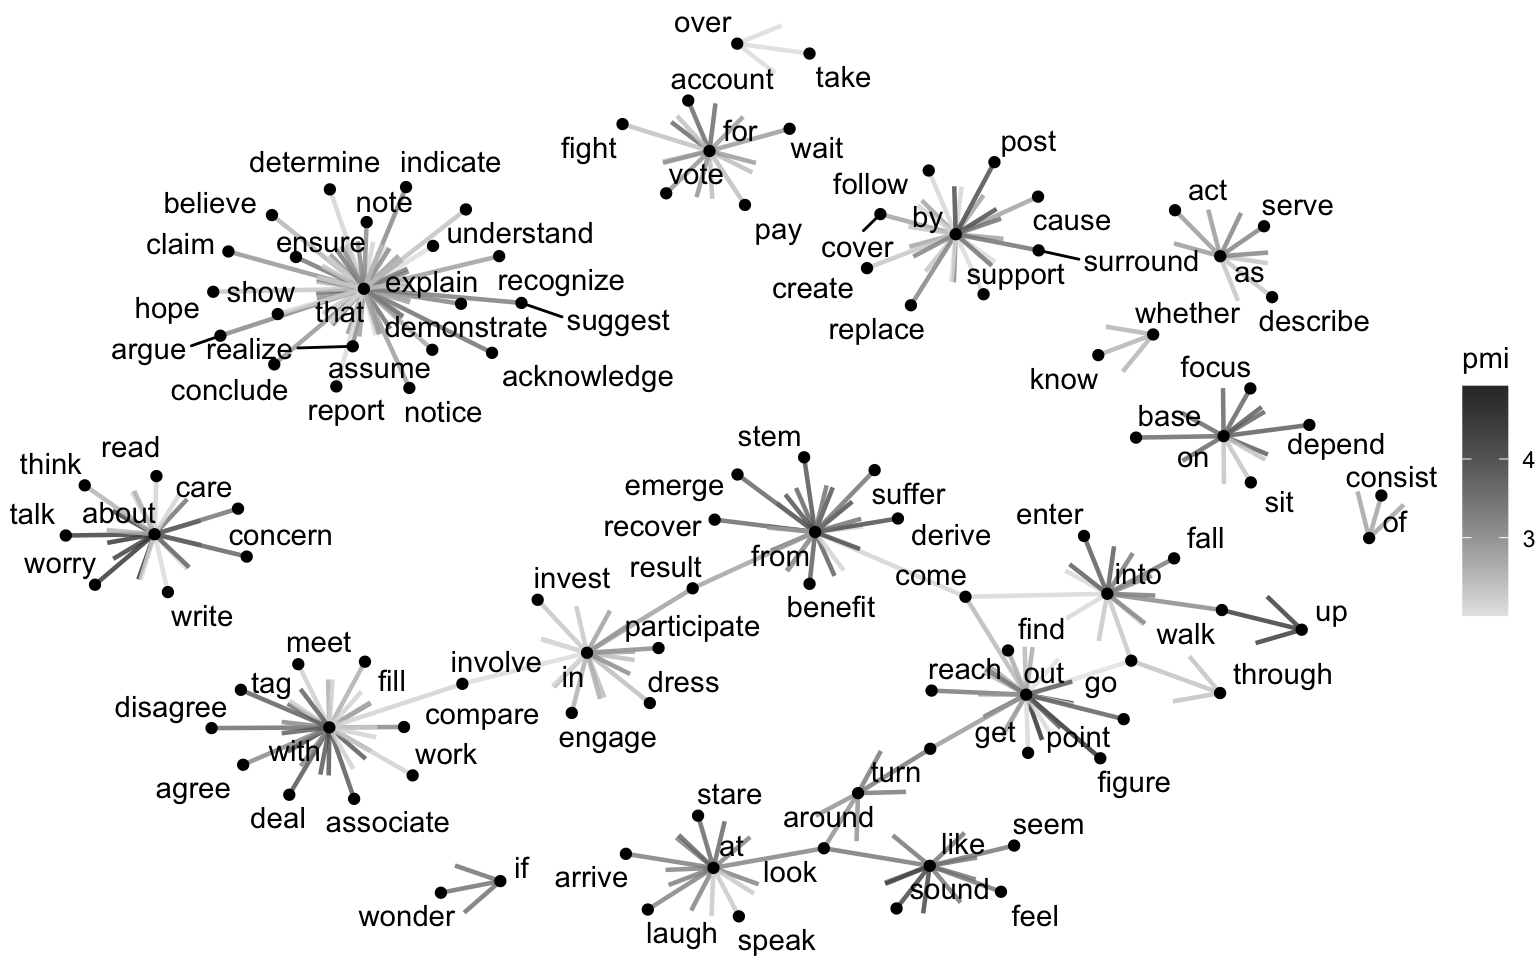
What can word embeddings tell us?
- Semantic relationships between words
- Grammatical relationships between words
- Analogies between words
- Clustering of words based on context
References
![]()
Kassambara, Alboukadel, and Fabian Mundt. 2020. Factoextra: Extract and Visualize the Results of Multivariate Data Analyses. https://CRAN.R-project.org/package=factoextra.
Meyer, David, and Christian Buchta. 2022. Proxy: Distance and Similarity Measures. https://CRAN.R-project.org/package=proxy.
Wijffels, Jan, and Kohei Watanabe. 2023. Word2vec: Distributed Representations of Words. https://CRAN.R-project.org/package=word2vec.