Analysis
Approaching statistical thinking for text analysis.
Feb 7, 2024
Overview
- Describe
- mixed in!
- Analyze
- Communicate
Central Tendency
A single statistic that aims to represent a variable.
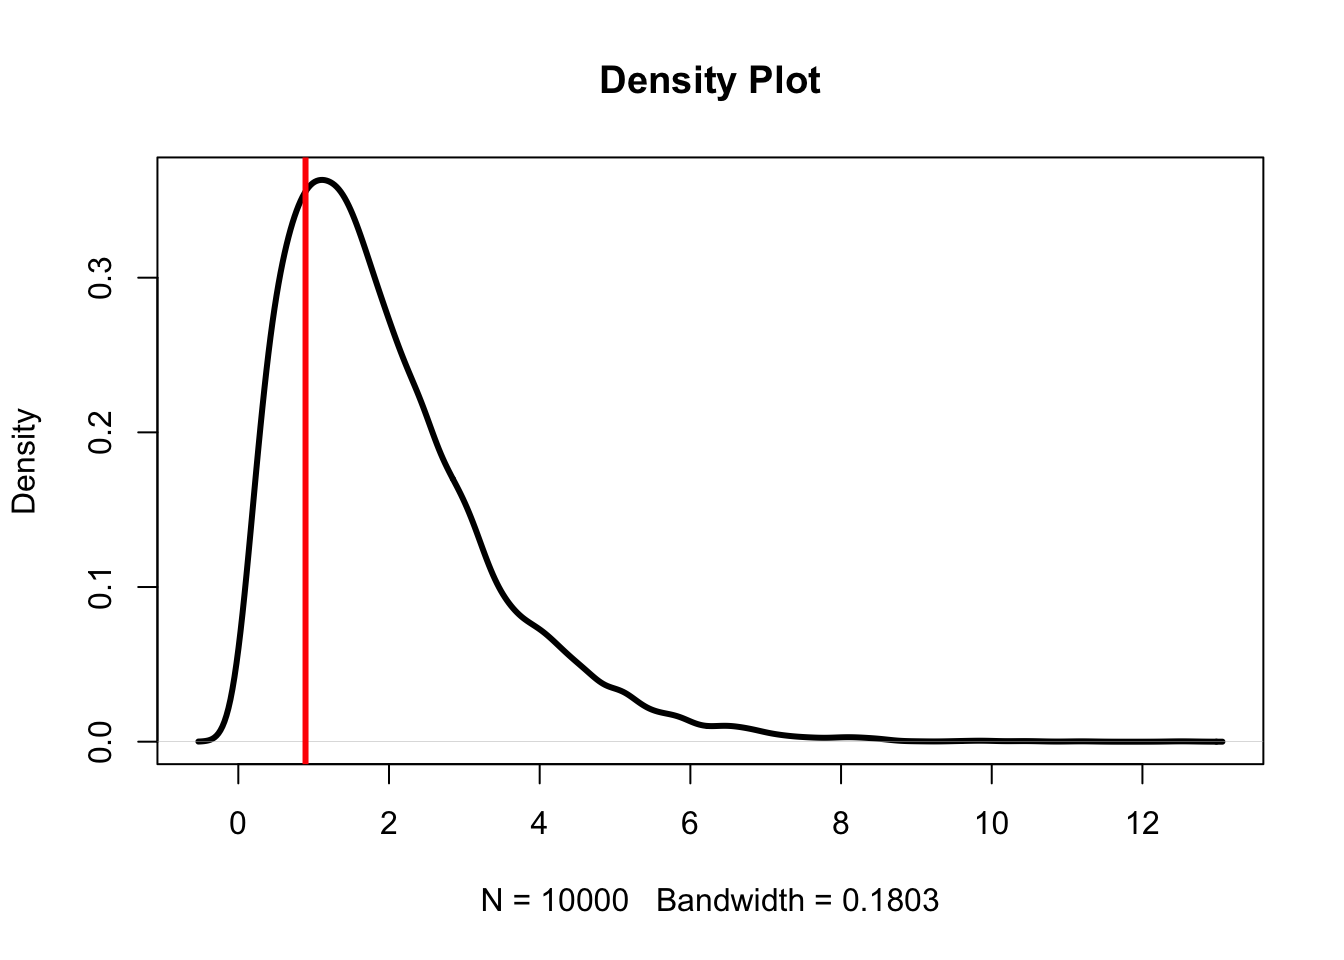
Mode
Most common
0.89
used most for categorical data
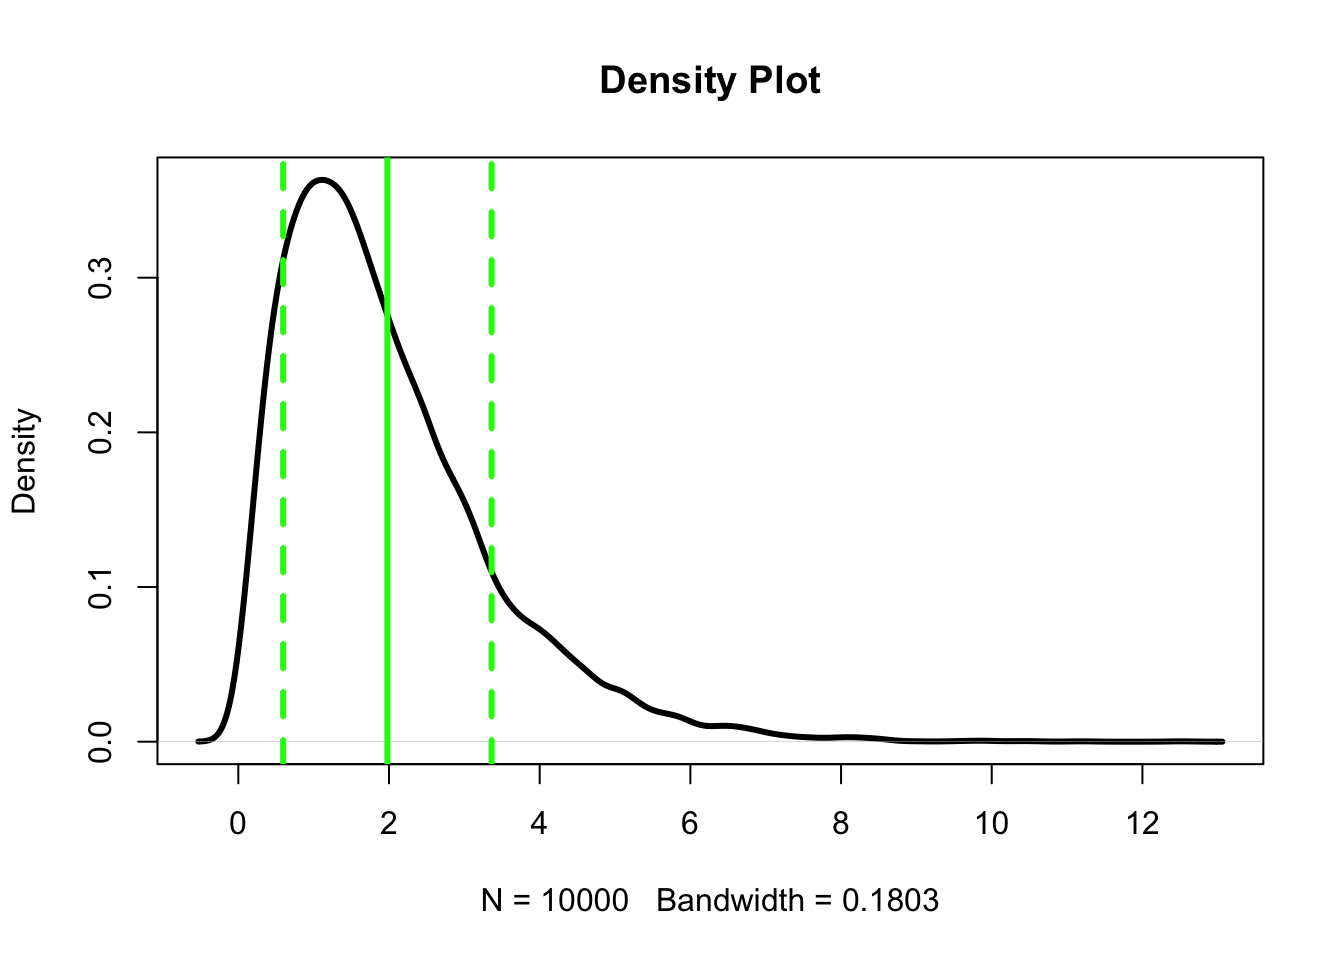
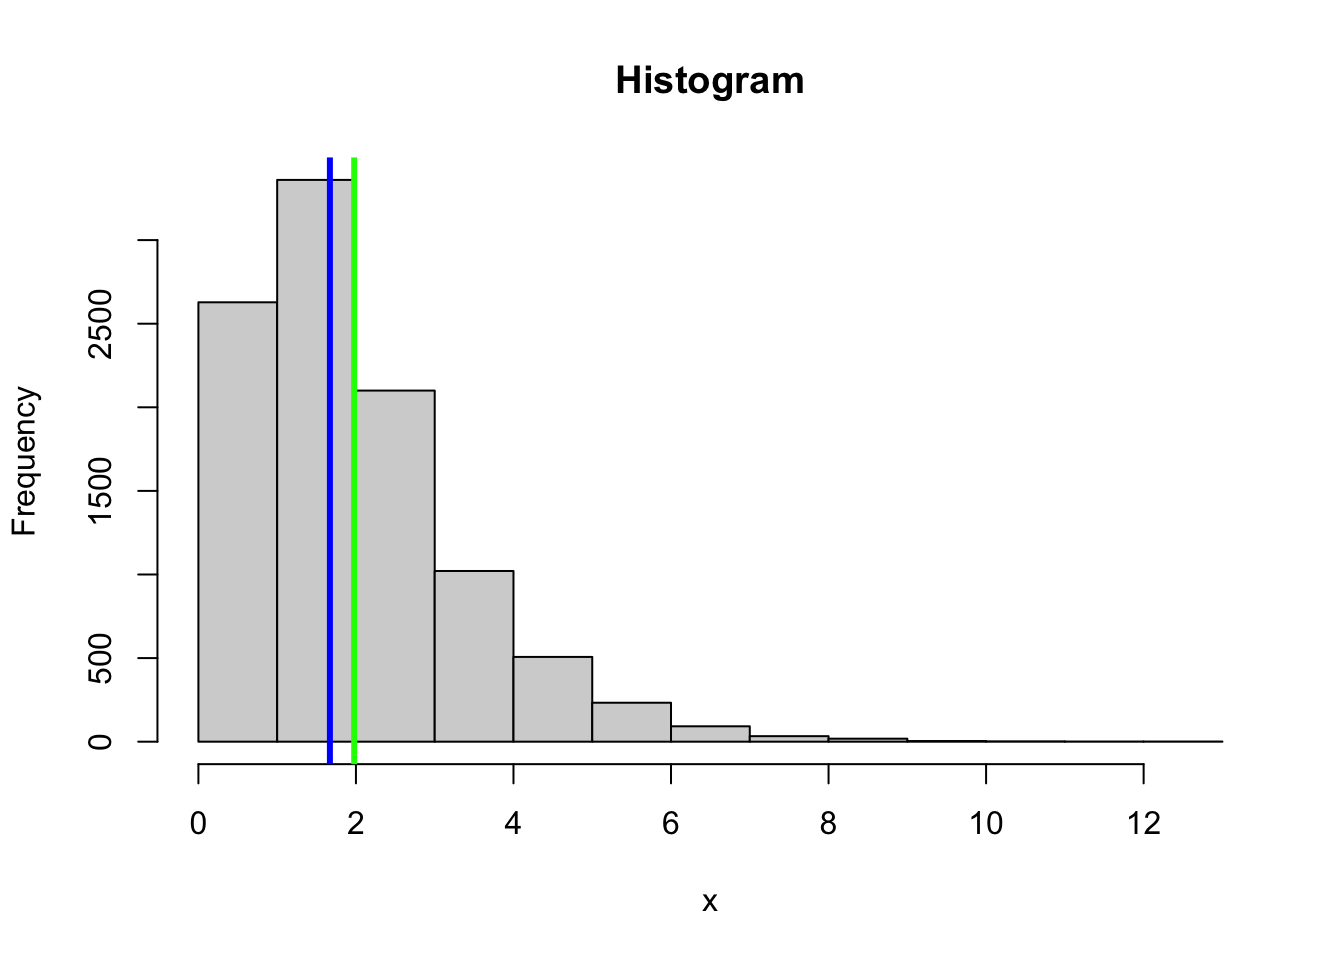
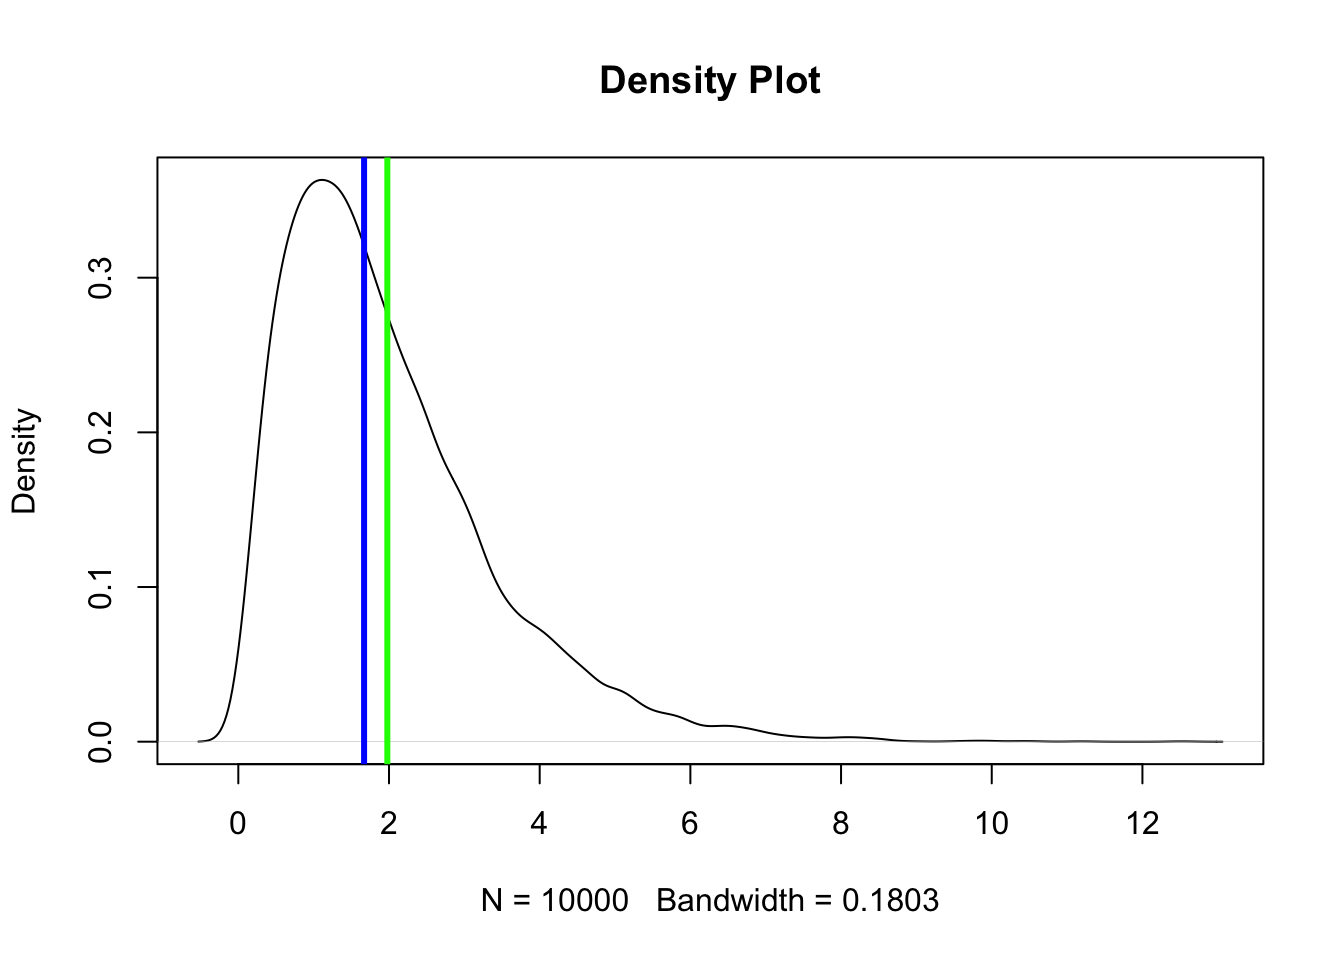
Mean
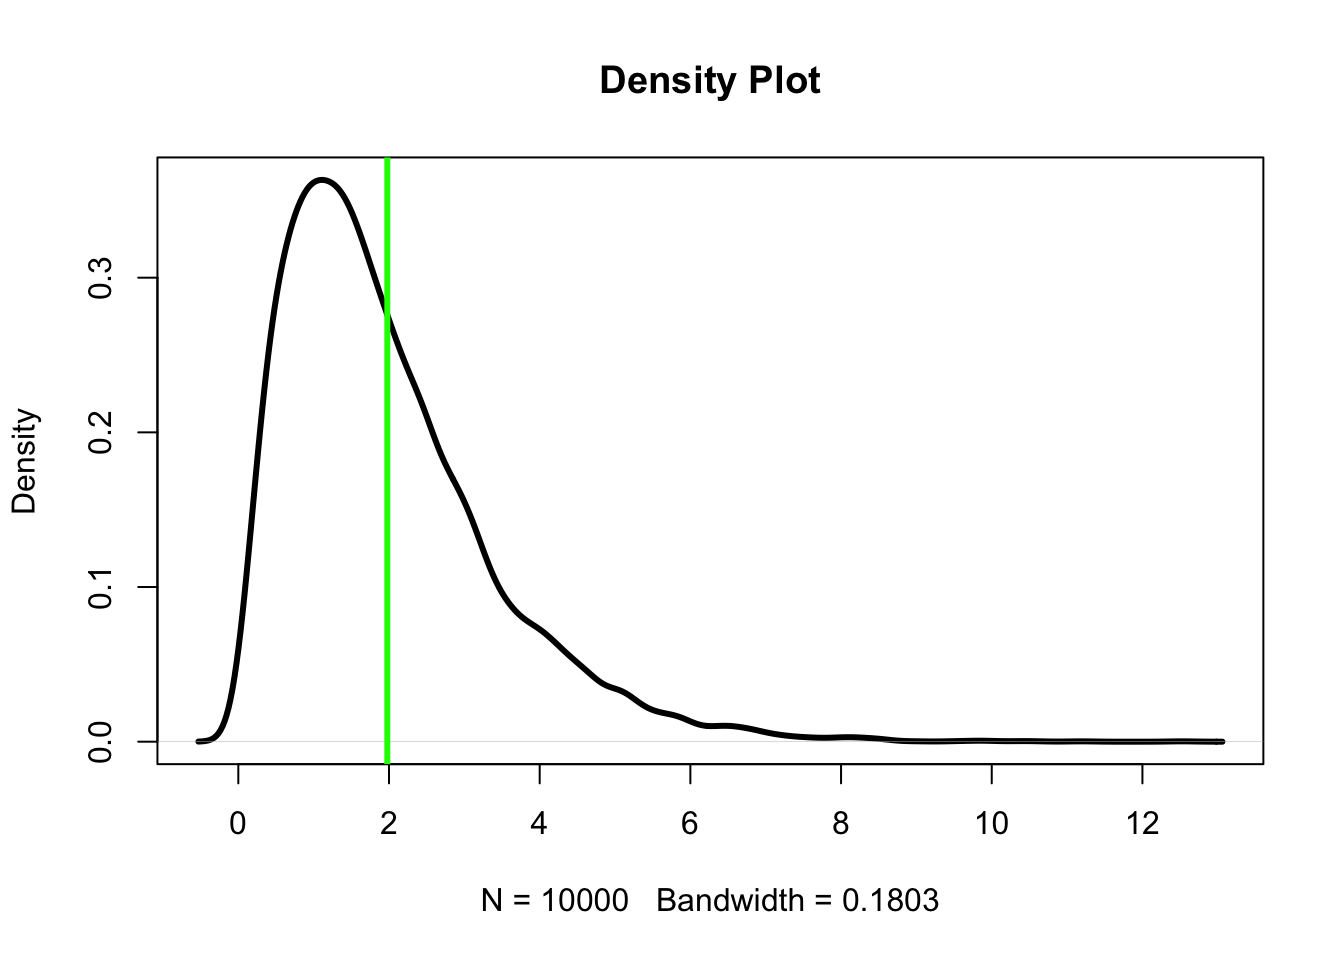
Average
1.98
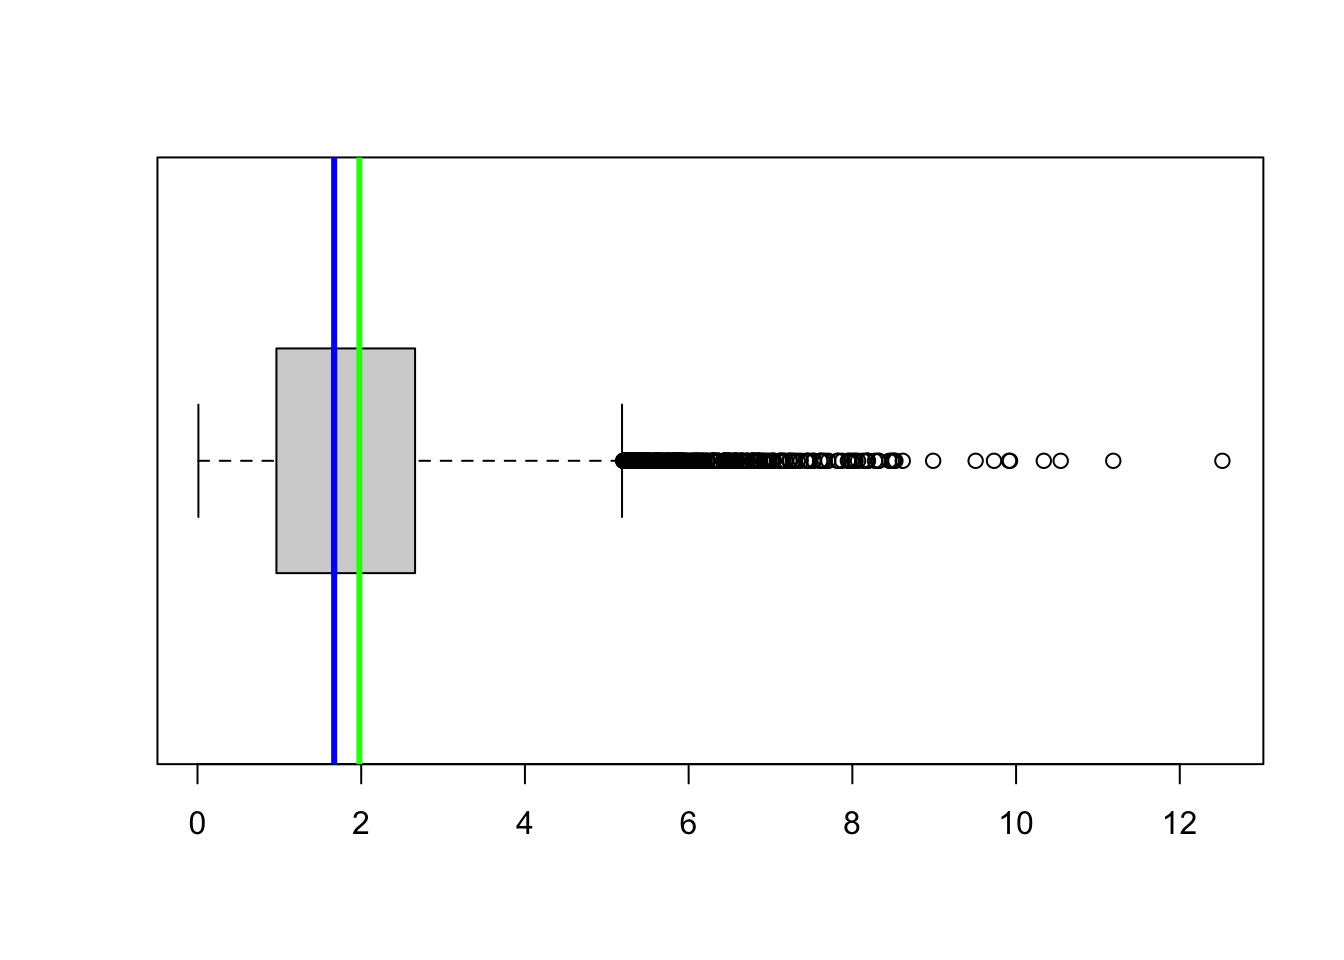
Median
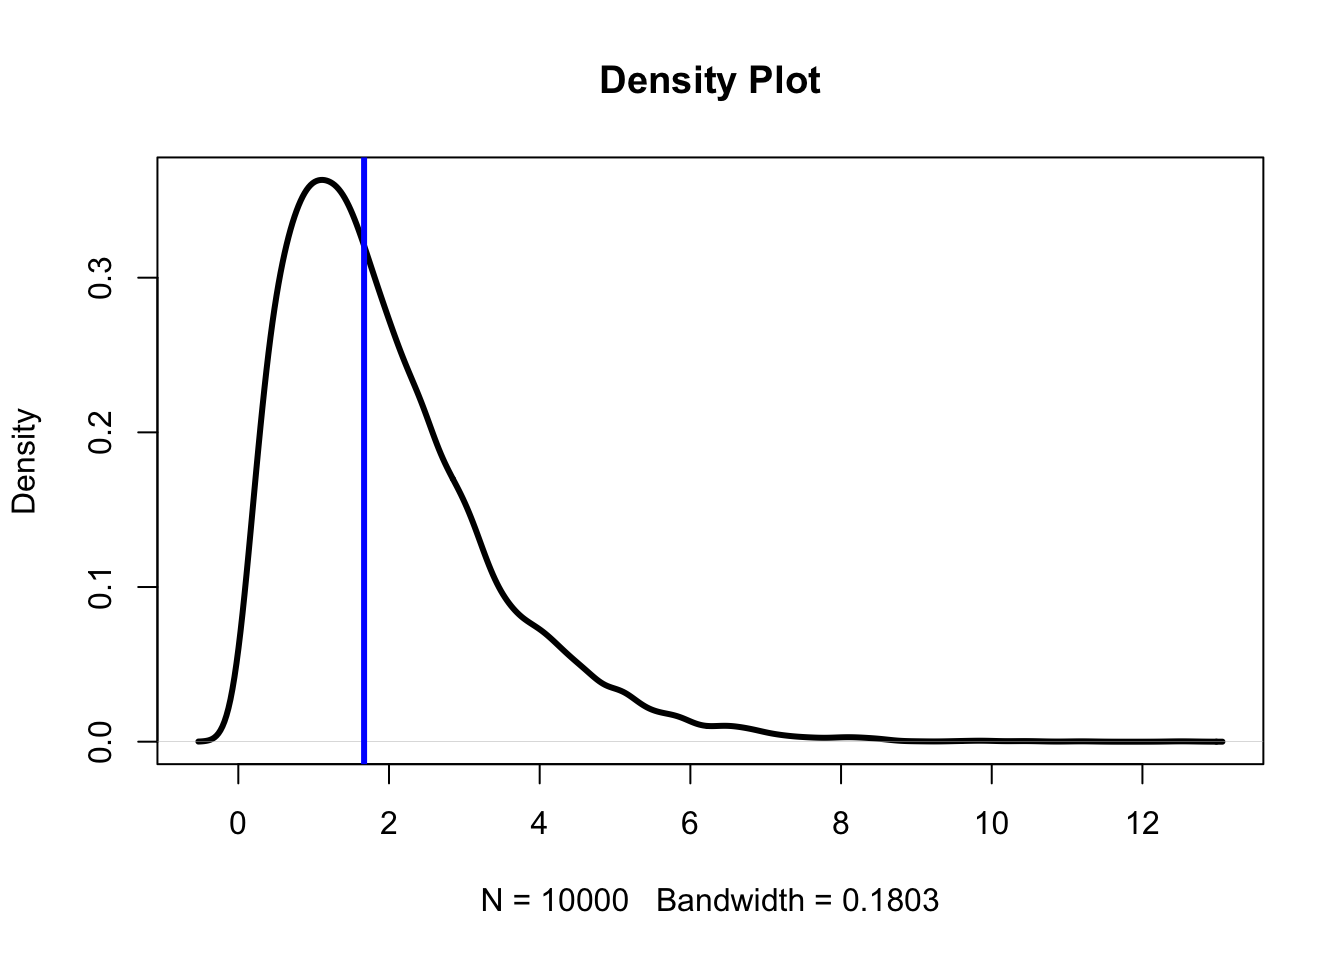
Middle
1.67
Dispersion
A single statistic to represent the variability of a variable.
Standard Deviation
1.38 around the mean
IQR (Interquartile Range)
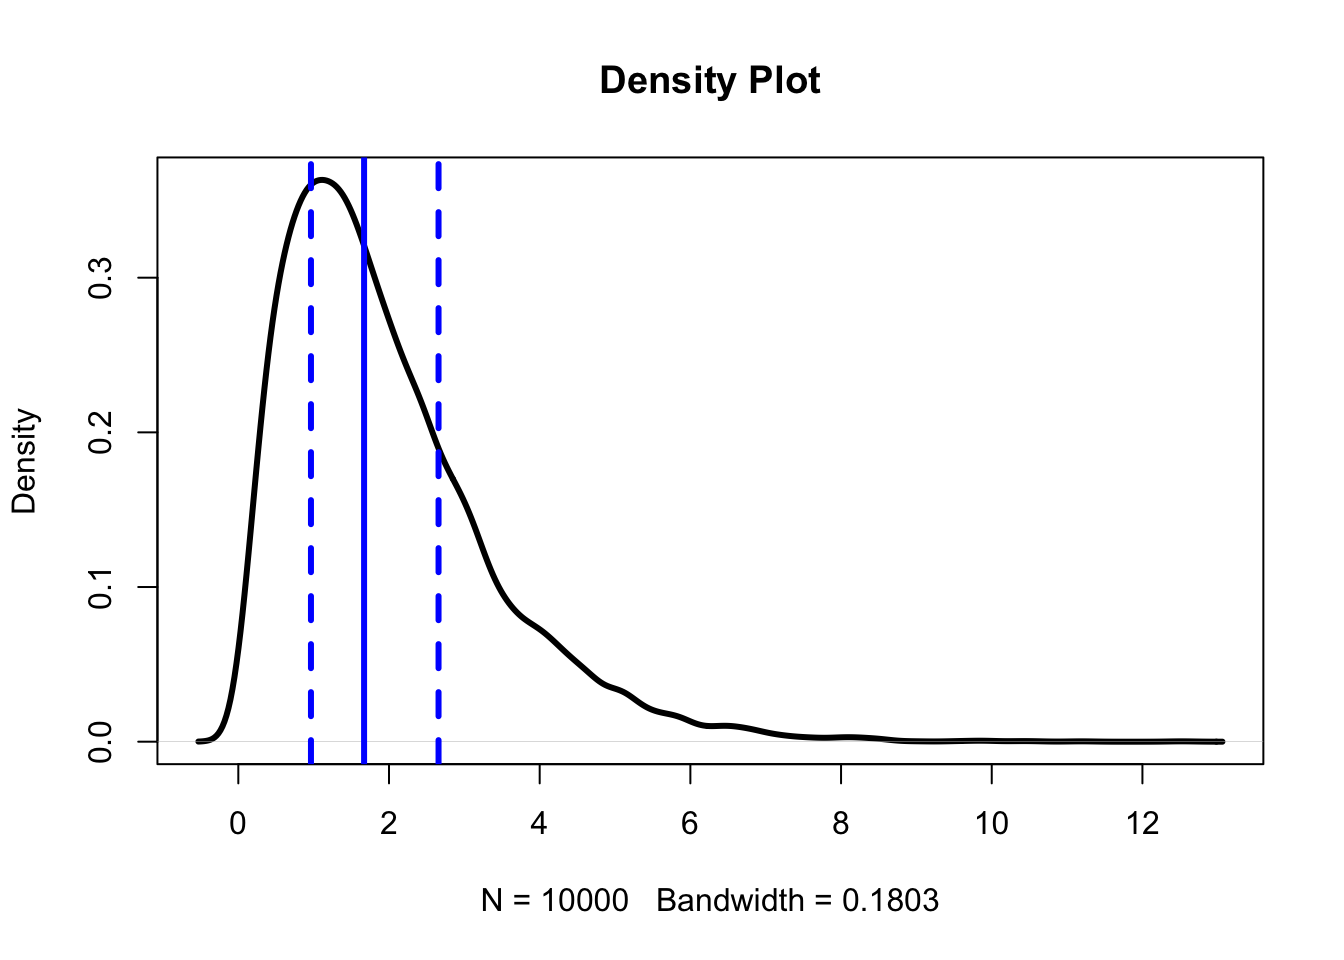
1.69 75\(^{th}\) - 25\(^{th}\) percentiles
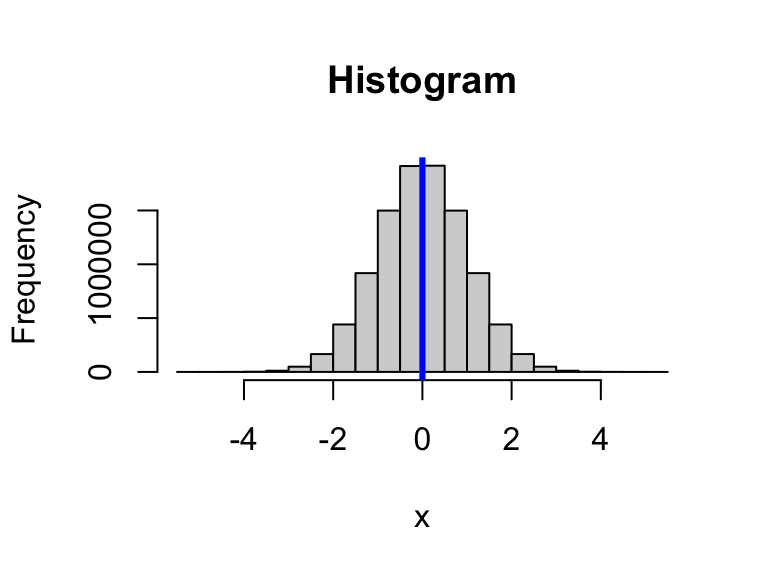
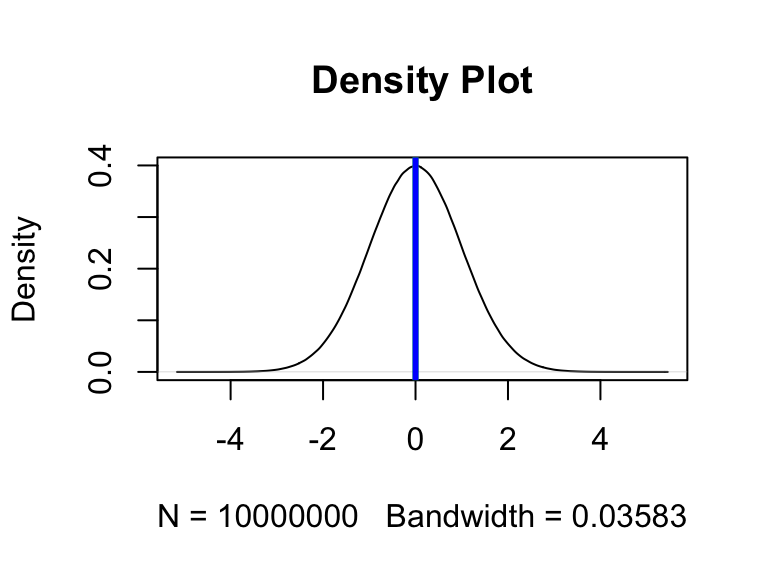
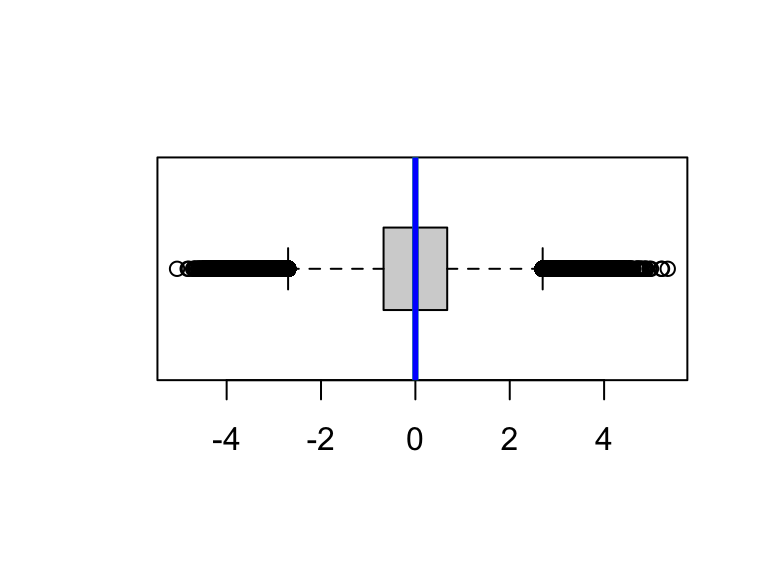
Distribution
Normal distribution
Skewed distributions
Document
References
![]()
Waring, Elin, Michael Quinn, Amelia McNamara, Eduardo Arino de la Rubia, Hao Zhu, and Shannon Ellis. 2022. Skimr: Compact and Flexible Summaries of Data. https://CRAN.R-project.org/package=skimr.
Wickham, Hadley, Romain François, Lionel Henry, Kirill Müller, and Davis Vaughan. 2023. Dplyr: A Grammar of Data Manipulation. https://CRAN.R-project.org/package=dplyr.